One of the fastest-growing design-build firms in America, LGE Design Build (LGE), today released its third quarter Construction Delivery Outlook report to examine trends within construction labor, supply chain and material costs across the country as well as in the company’s key markets of Phoenix and Dallas.
READ MORE: 4.567 acres of church land in North Scottsdale sells for $850,000
“Despite the lingering challenges created by the pandemic, our report highlights the resiliency of the construction industry and provides reason to be optimistic for the future,” said Blake Wells, vice president of preconstruction at LGE Design Build. “Construction continues to thrive in Dallas-Fort Worth, driven by the rise of healthcare, education, immersive entertainment venues and tenant improvement projects. Dallas’s construction spending index remains robust at 1.57 as of July 2023, surpassing the national average of 1.22. In Phoenix, even in the face of rising interest rates and water supply shortage concerns, the construction spending index continues to flourish at 1.74 and is projected to rise to 1.85 by the end of the year.”
A summary of the report’s key findings include:
Phoenix construction labor trends
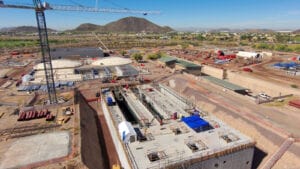
The construction industry’s persistent labor and skills shortage isn’t expected to resolve itself soon. Contractors are grappling with substantial demand for large-scale projects like chip manufacturing plants and clean energy facilities, all while facing a scarcity of younger talent entering the skilled trades. Other notables:
- As of Q2 2023, Phoenix construction trends show a 2.3% increase in labor availability, but construction volume has declined by -13.4%, significantly alleviating the strain on the labor pool.
- The construction unemployment rate in the Phoenix market has decreased slightly from 6% to 5.6% compared to last year. However, despite this improvement, there are still challenges in finding available labor, particularly in more sophisticated trades.
- In Dallas, a similar scenario is observed, with labor increasing by 4.9% and construction volume rising 0.4% above its 2022 low of -2.7%.
- Despite fewer construction starts, with Q1 seeing a 23% decline in DFW commercial building activity, Dallas leads in adding construction jobs. In the year ending in May, the city added 11,600 building sector jobs, the highest number in the U.S., according to the Associated General Contractors of America.
Supply chain
On June 8, White House officials announced that supply chains are improving. Port congestion has disappeared, and inflation has reduced to 3% in June 2023, the lowest level since March 2021. Other notables:
- Container freight costs from China to the U.S. West Coast are now lower than pre-pandemic levels and transport costs have decreased from 2022 peaks but remain elevated due to higher wages and fuel prices. Ocean container rates dropped due to more capacity and less demand.
- While the supply chain is healing, challenges still exist. The “2023 Supply Chain Perspective” survey found that 72% of companies still face supply chain challenges.
- The most significant procurement pain points include HVAC units, electrical panels and drywells.
Material costs
A recent report by global construction firm Rider Levett Bucknall (RLB) reveals that construction costs in Phoenix may have risen in the past three years due to supply chain challenges and other factors. Although these cost increases are now showing signs of stabilizing, they remain higher than most markets. Other notables:
- In May 2023, Phoenix’s construction expenses were 7.58% higher compared to the same month the previous year, ranking it fifth in cost escalation among 12 major U.S. metro areas.
- In Dallas, efforts to combat inflation seem to be yielding positive outcomes. Despite supply chain disruptions causing delays, pricing has moderately stabilized. This excludes specific items with extended lead times such as electrical.
- Prices for concrete and flat glass continued to trend upward in recent months, whereas materials such as aluminum mill shapes, copper and gypsum have generally trended downward.
Demand by product type
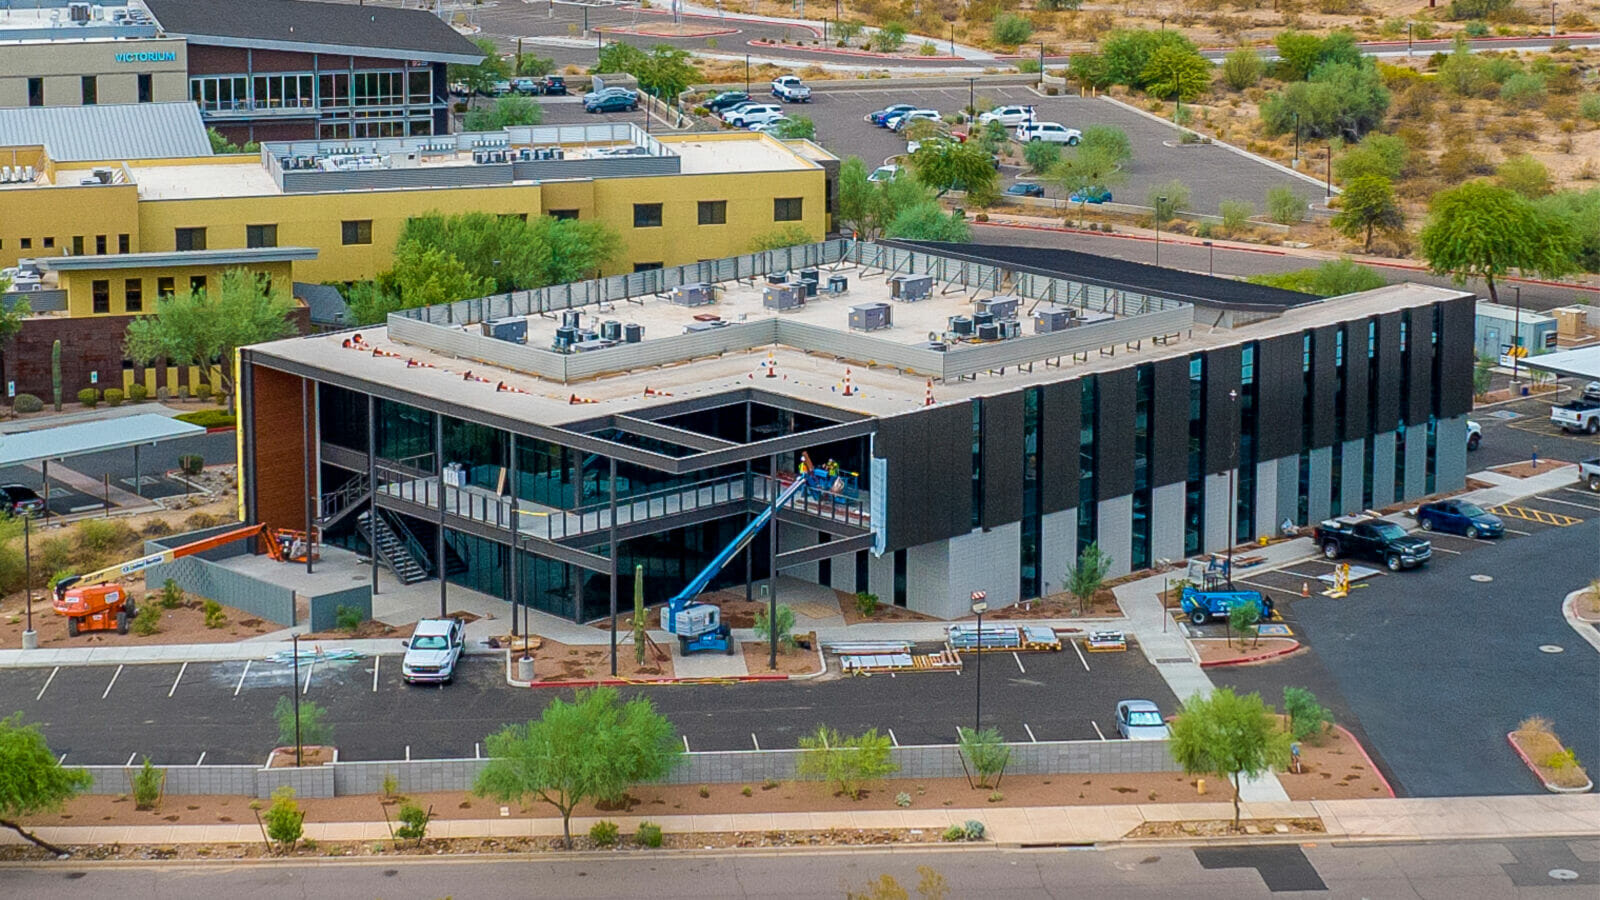
Despite a nationwide slowdown in mega warehouse deals for e-commerce and logistics companies due to the pandemic, Phoenix’s industrial market continues to be driven by those same sectors. The region has surged to the top of the industrial ranks, fueled by the current manufacturing boom and companies relocating from California. Other notables:
- In June 2023, the Phoenix metro had an impressive 58 million square feet of industrial space under construction, accounting for about 16.6% of the existing inventory and surpassing supply pipelines in other major regions like Dallas-Fort Worth and the Inland Empire.
- Positive absorption in Central Business District submarkets hit hard during the pandemic suggests a potential urban core recovery. The prime south Scottsdale submarket showed significant occupancy growth, with 198,509 square foot net absorption. Although average direct rents are stable quarter-to-quarter, they have increased by 3.5% YoY across the Valley.
- Despite a peak in the pipeline in Dallas last quarter, the Dallas-Fort Worth industrial market remains at the forefront of national development activity, with occupier demand for the first half of 2023 surpassing pre-pandemic levels after consecutive record-breaking years.
- Dallas’ direct asking rents surged to $34.14 per square foot in Q2, reflecting a 3.2% YoY growth. Far North Dallas and Las Colinas are grappling with high sublease availability, while Class A properties saw a 1.2% overall YoY decline to 8.3 million square feet. Despite rising national and local office vacancy rates, the disparity in performance since 2020 has led older assets to bear the brunt, with 90% of the market’s vacancy concentrated in just 35% of existing buildings. Leasing activity dropped by 27.6% YoY due to a delay in large-scale deals, but Dallas still ranked among the top five markets nationally.
To view the full Construction Delivery Outlook report and to learn more about Phoenix construction trends, click here. For more, visit LGEDesignBuild.com.