More office space will be removed from the U.S. market trough conversions and demolitions this year than added to it for the first time since at least 2018 and likely longer, providing another indicator of the market’s stabilization and nascent recovery, according to a new report from CBRE.
CBRE’s analysis of office-market activity across the largest 58 U.S. markets found that, by the end of this year, 23.3 million sq. ft. of space is slated for demolition or conversion to other uses. In comparison, developers are projected to complete construction of 12.7 million sq. ft. of office space in those markets this year.
LOCAL NEWS: 100 best places to work and live in Arizona for 2025
INDUSTRY INSIGHTS: Want more news like this? Get our free newsletter here
The crossing of these trends has been years in the making. Nationally, construction completions have steadily declined from 51.2 million sq. ft. in 2018 to 25 million last year and the anticipated 12.7 million this year. Meanwhile, conversions alone – factoring out demolition – have increased from 5.5 million sq. ft. in 2018 to an anticipated 12.8 million sq. ft. this year.
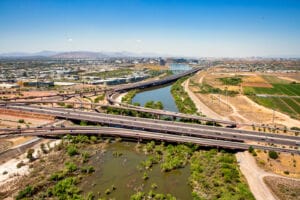
Phoenix has 15 projects totaling 3 million square feet of office space that are underway or planned for conversion or demolition this year. That compares to 424,000 sq. ft. active office construction. Phoenix will see a net reduction in office inventory this year, just like nationally but to a greater extent.
The Valley has also seen a rise in office-to-industrial conversions since the pandemic. Between 2019 and 2022, three projects were converted, including Riverpoint (4150 South Riverpoint Pkwy.) in Phoenix and ICE Gallery (15501 North Dial Blvd.) in North Scottsdale. Four additional conversions are planned, including the Executive Center at Southbank, located near Phoenix Sky Harbor International Airport.
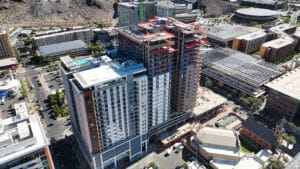
There are four multifamily conversions planned and one underway, the 163-unit One Camelback located at Central Avenue and Camelback Road. Office properties are also being converted into mixed-use properties with a residential component. One of these types of conversions of the Punchcard Building, in addition to space for retail, will also feature 335 multifamily units. The project is expected to start construction within a year.
CBRE has tracked office conversions and demolitions since 2018. Construction completions handily exceeded conversions and demolitions in each year until 2025. Completions likely exceeded conversions and demolitions prior to 2018, given that office construction was robust and conversion activity minimal in past decades.
Various other indicators depict a U.S. office market that’s slowly turning the corner. Net absorption – the amount of space newly occupied in a quarter versus the amount newly vacated – has been positive for the past four quarters after six straight quarters of negative absorption. Office-leasing activity increased 18% in the first quarter from a year prior. Still, the national vacancy rate continues to hover around its all-time high of 19%.
Developers currently have another 81 million sq. ft. of office space in the pipeline for conversion to other uses in the coming years.
“This net reduction – albeit slight – of office space across major markets likely will contribute to lowering the vacancy rate in the quarters ahead, which would benefit building owners,” said Mike Watts, CBRE Americas President of Investor Leasing. “However, the conversion trend faces a few headwinds. The pool of ideal buildings for conversion will dwindle over time. And costs for construction labor, materials and financing remain high.”
Tariffs are yet another factor in that they have increased the cost of many construction materials and contributed to economic uncertainty that makes financing large projects challenging.
Market-By-Market View
Conversion activity varies widely by market. Manhattan, Washington, D.C., and Houston have the most office square footage planned or under construction for conversion. Meanwhile, Cleveland (8.4%) and Cincinnati (6.6%) have the largest percentage of their overall office square footage under conversion.
| Market | Office Square Footage Earmarked for Conversion | Percentage of Market’s Overall Office Square Footage Set for Conversion |
| Manhattan | 10.3 million | 2.5% |
| Washington, D.C. | 9.2 million | 2.7% |
| Houston | 6.7 million | 3.2% |
| Chicago | 4.8 million | 1.9% |
| Dallas/Fort Worth | 4.4 million | 2.0% |
| New Jersey | 4.2 million | 2.8% |
| Orange County, CA. | 4.2 million | 4.0% |
| Atlanta | 3.6 million | 2.4% |
| Phoenix | 3 million | 2.8% |
| Cleveland | 2.8 million | 8.4% |
Most Conversions to Multifamily
Multifamily has increased its already dominant share of conversion projects. Seventy-six percent of active conversion projects are planned to become multifamily complexes as of last month. The next most popular option, hotels, account for only 8% of the conversion pipeline. Life sciences labs, previously among the top options, have fallen to 3% of the pipeline, behind “other” uses (10%) and Industrial & Logistics uses (4%).
CBRE calculates that, since 2016, office conversions to multifamily have generated 33,000 apartments and condominiums. Projects in the pipeline stand to add another 43,500 units to the housing market. CBRE’s analysis relies on the historical average of 170 units per conversion project.
“The amount of residential units added to the national inventory from conversions won’t come close to solving the national housing shortage, but it will help, especially on a local level,” said Jessica Morin, CBRE’s Americas Head of Office Research. “Meanwhile, the office market will benefit as obsolete space is removed from the market in favor of the highest and best use. Additionally, conversions will boost the vibrancy of neighborhoods within various markets.”
To read the full report, click here.