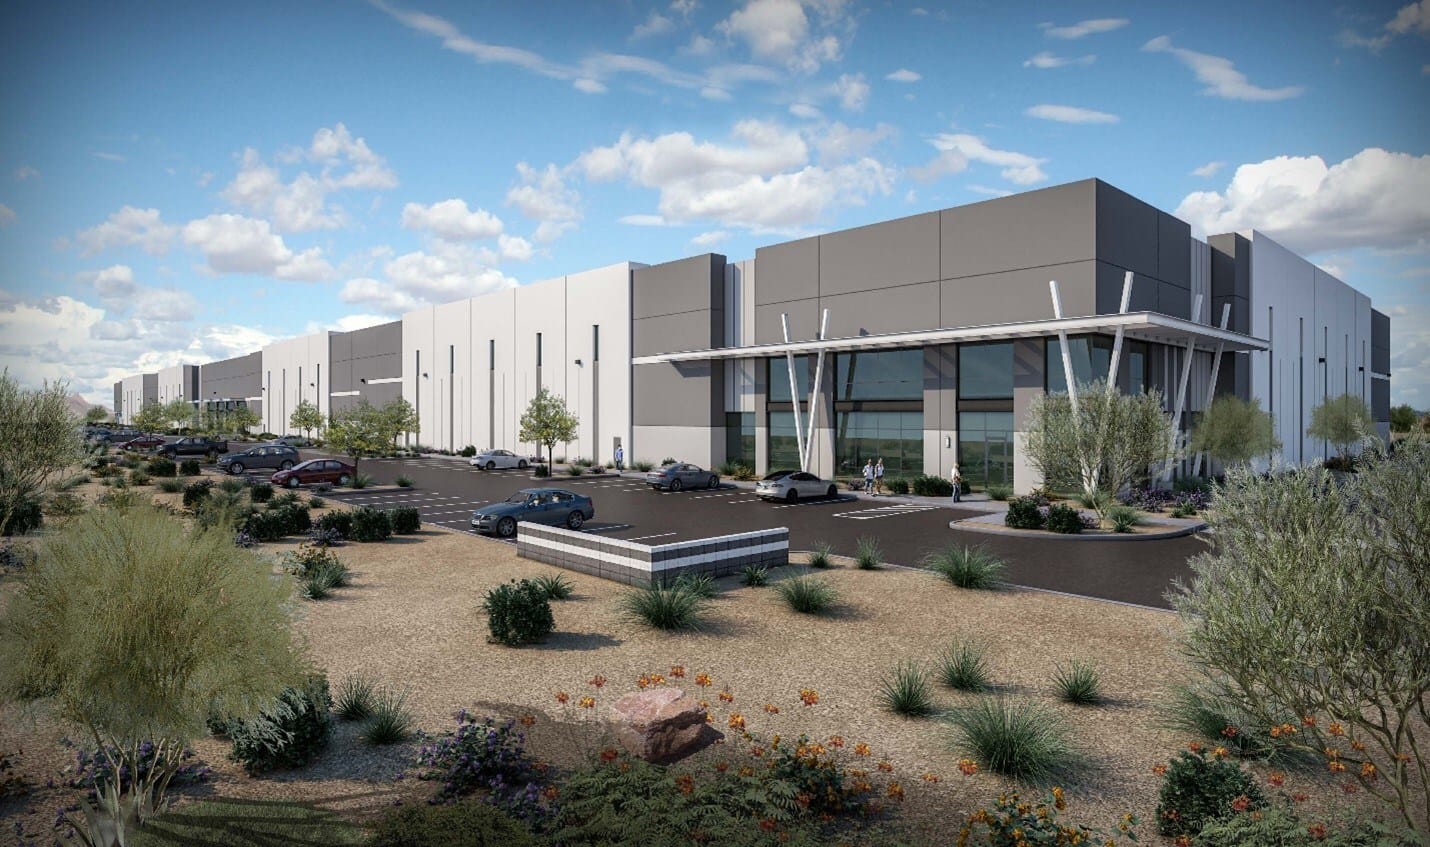
While many markets have seen their pipelines shrink considerably in 2024, Phoenix is an exception. There are 36.8 million square feet of industrial development underway in Phoenix, with 10.6 million square feet starting in 2024, the most of any market, according to the latest industrial market report from CommercialEdge.
MORE NEWS: Phoenix moves ahead of Silicon Valley in data center supply
Despite the influx of new industrial supply in recent years, Southern California continues to command the highest rent growth in the U.S., according to our latest industrial market report. Orange County leads the way as the priciest industrial market nationwide, with average rents at $15.70 per square foot, and Los Angeles follows at $14.93 per square foot — both far exceeding the national average of $8.11 per square foot.
Other key takeaways:
- The Inland Empire saw rents jump 12.1% Y-o-Y, even as vacancy rates dropped 40 basis points month-over-month
- Los Angeles surpassed $2 billion in sales volume in August, ranking third nationally
- The Bay Area held the top spot for U.S. sales prices at $483/square foot, despite a $35 decline from the previous month
- Phoenix leads U.S. industrial development with 36.8 million square feet under construction, though activity dropped 28% Y-o-Y
E-commerce Adjusts and Set to Grow Again
The e-commerce boom experienced during the pandemic waned last year, leading to a softened demand for industrial space. Now, in 2024, this sector appears to have rebalanced and is growing at a steady pace, according to our latest U.S. industrial market report.
The Census Bureau reported e-commerce sales of $291.6 billion in the second quarter, marking a 1.3% increase over the first quarter and a 6.7% year-over-year growth. E-commerce’s share of core retail sales (excluding motor vehicles, their parts and gasoline) had stagnated during most of 2021 and 2022. However, it has been on the upswing for six consecutive quarters, reaching 18.8% in the second quarter, the highest level since the peak of pandemic-related shutdowns.
The Warehouse and Storage sector of the labor market is also experiencing growth, according to the Bureau of Labor Statistics. A total of 24,900 jobs in the sector have been added year-to-date through August. While these are modest gains for a sector employing nearly two million workers, they signal improvement in a sector that shrank by 8.5% between May 2022 and December 2023.
New Lease Rates Show Signs of Moderation
National in-place rents for industrial space averaged $8.11 per square foot in August, down four cents from July but up 7.2% year-over-year, our latest U.S. industrial market report shows.
In-place rents have increased the most along the coasts, with the largest gains over the last 12 months found in the Inland Empire (12.1%), Miami (10.6%), Los Angeles (10.1%), New Jersey (9.0%) and Orange County (8.3%). While the supply boom has led to higher vacancies and moderated advertised rents, leases signed before the pandemic will continue to expire in the coming years. As tenants renew leases or move into new spaces, in-place rents are expected to keep climbing, according to industrial property outlooks.
The national industrial vacancy rate was 6.7% in August, up 30 basis points from the previous month. The massive wave of new supply delivered over the last few years continues to significantly impact the national vacancy rate, which hovered near 4% just two years ago.
Development Remains Historically High Despite Cooldown
Nationally, 369.3 million square feet of industrial space was under construction as of August, representing 1.9% of stock, our U.S. industrial market report reveals.
Industrial development may have cooled, but by historical standards, it remains elevated. Nearly 1.9 billion square feet started construction between 2020 and 2023, but this year, starts have fallen to 145.3 million. Despite the slowdown, 2024 is on track to finish roughly at 2019’s level of 195.8 million square feet of starts. Before the pandemic sent demand for industrial space into overdrive, 2019 was a high water mark in over a decade.
While many markets have seen their pipelines shrink considerably in 2024, Phoenix industrial development is an exception. There are 36.8 million square feet underway, with 10.6 million square feet starting in 2024, the most of any market. Although Dallas-Fort Worth’s pipeline has downsized considerably from last year, it still ranks second nationally in square footage under development, with 16 million square feet in progress. Other markets with strong industrial construction activity include Philadelphia (12.4 million square feet), Kansas City (10.4 million), Chicago (10.3 million) and Memphis (10 million).