
In the first quarter of 2025, Phoenix ranked 6th among the nation’s larger office markets, with top 10 placements across several key indicators: The market recorded the 4th-largest slip in vacancy rate; added more than 330,000 square feet of office space, which represented the 4th-largest market expansion as a percent of stock; and ranked 4th for the share of loans expected to mature by the end of the year.
Caution and financially strategic investment still prevail across the U.S. office sector: While some recovery has occurred in the national market, it has not been equally distributed. Specifically, top-tier properties in key locations still significantly outperform other tiers in terms of leasing and occupancy.
And, while the effect of recent economic policies has not yet had a noticeable effect on office demand, leasing still tends to show a preference for a reduced tenant footprint and increased flexibility. Furthermore, the importance of flexibility is also notable in the continued expansion of the coworking segment, where data showed increased momentum across a greater number of markets during the first three months of the year.
Below, we ranked the 100 largest office markets in the country by comparing their performances in terms of fundamentals — including asking rent, vacancy, market expansion and loan maturities — and scoring how each of them kicked off the year.
DEEPER DIVE: 20 emerging business categories gaining traction in Arizona
INDUSTRY INSIGHTS: Want more news like this? Get our free newsletter here
Key Takeaways
Top 10 Office Markets in Q1
- Boston, Baltimore and Orange County, Calif., topped the ranking of largest office markets in Q1 2025.
- Eight of the 10 best-performing mid-sized markets in Q1 were concentrated east of the Mississippi, including four hailing from Florida alone.
Top Scores for Each Ranking Metric Category (jump to section)
- Vacancy: Though rates continued to inch up during Q1, more markets saw larger quarter-over-quarter slips in office vacancy compared to Q4.
- Asking rent: Rents continue to adjust across the sector with roughly half of the markets we compared seeing values trending upward in Q1.
- Office construction: More than 9 million square feet of office space was added in Q1 across 37 of the markets analyzed.
- Coworking space: Data showed quarter-over-quarter growth of the coworking segment in nearly 30% of the office markets we compared.
- Loan maturities: In 41 of the markets we compared, less than 10% (each) of future loans are due to mature in 2025.
- Search trends: Online search trends for office, as well as for coworking space, showed notable increases in interest compared to Q1 2024.
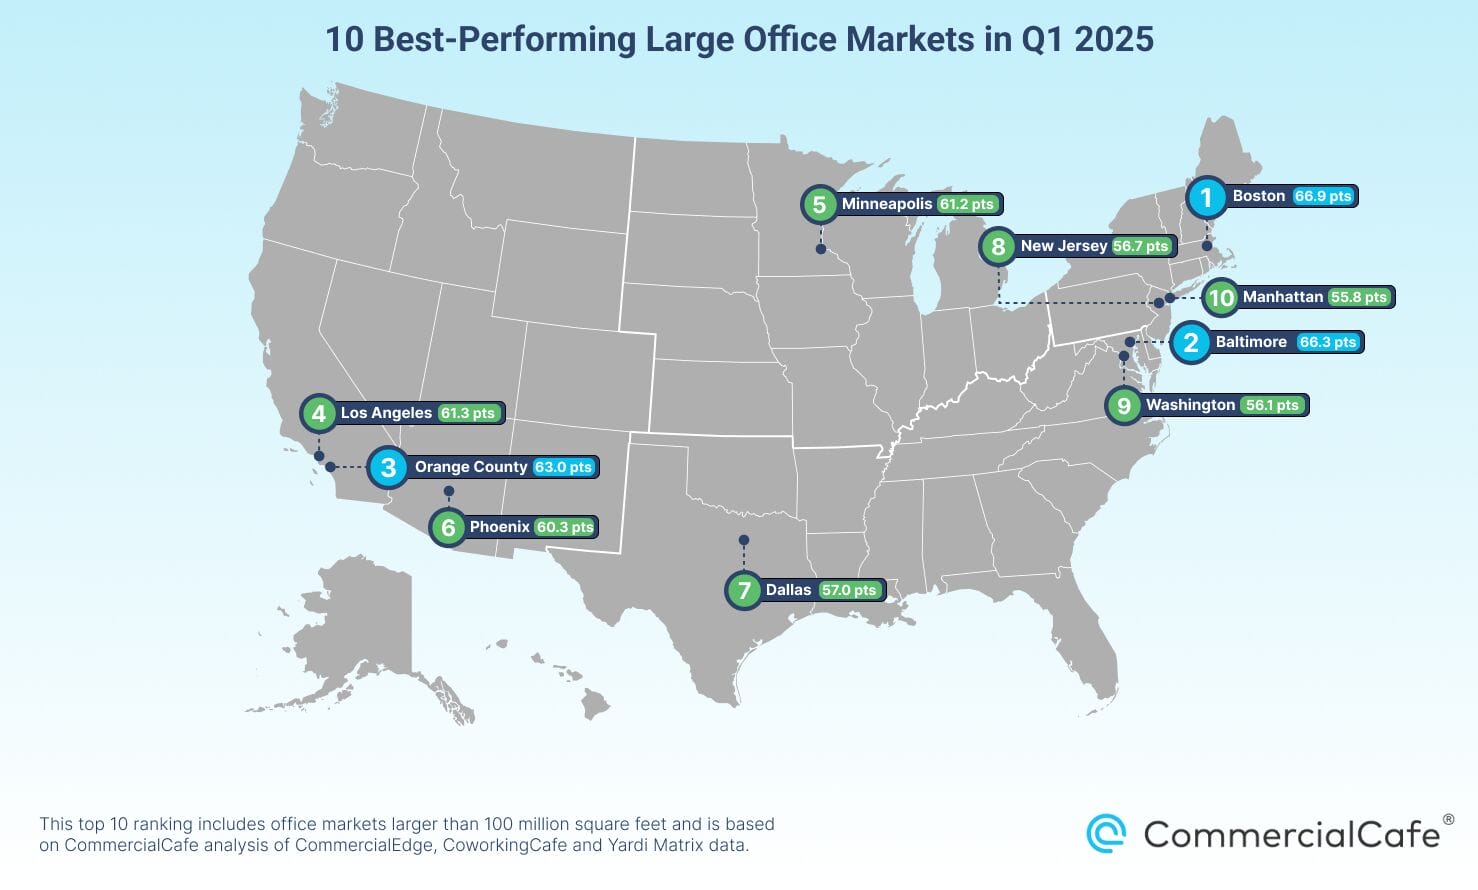
Top 10 Office Markets Larger Than 100M Square Feet
Boston remained the best-performing large office market for the third quarter in a row, scoring nearly 67 points out of a potential 100 across the indicators we analyzed in Q1 2025. Boston’s best performances this past quarter stemmed from the expansion of its local coworking scene, future expansion of its office market and its office vacancy rate.
Specifically, Boston scored second-highest for amount of coworking space added during Q1, as well as what that space meant in terms of increase of the share of coworking out of total office in the market. Additionally, Boston earned the third-highest score for the percentage of office stock under construction at the start of the year. It also had the fourth-lowest office vacancy rate among the larger markets analyzed for this ranking report.
With a total of a little more than 66 points out of 100, Baltimore scored very closely behind Boston to rank as the second-best office market in Q1 2025. Office vacancy here was the sixth-lowest of the large markets we ranked. Notably, this marked the largest percentage-point drop from Q4 2024, an indicator for which Baltimore earned the top score on the Q1 scale for this indicator. And, while office space completed here during Q1 was the second-most square footage delivered, it nevertheless represented the largest market expansion as a percentage of stock.
Orange County, Calif., scored third-best in Q1 2025 (63 points) among office markets larger than 100 million square feet. Within this group, the Orange County office market earned the top score for year-over-year increase in average asking rate, as well as for its comparatively good outlook in terms of loan maturities due in 2025. Additionally, office space here had the fifth-lowest vacancy rate during the first quarter of the year, right behind Boston and slightly ahead of Baltimore.

Next, Los Angeles earned the fourth-best score in Q1 2025. The California market sported the second-lowest vacancy rate, and office space here saw one of the 10 largest increases in average asking rent during the previous 12 months. In this case, the local coworking scene also earned Los Angeles some noteworthy scores: Coworking space added here during the first quarter of the year received the third-highest score and represented the sixth-largest increase in the share of coworking space out of the total office space in the market.
Then, Minneapolis-St. Paul rounded out the top five for office markets larger than 100 million square feet. It’s worth noting here that the Twin Cities office market kicked off the year with the lowest vacancy rate of the quarter within this ranking group. The growth of the local coworking scene also equated to top-10 scores both in terms of coworking square footage added during Q1 (ninth-most) and for the share of coworking out of the total office space (seventh-largest).
Placing sixth-best among large markets in Q1 2025, Phoenix earned top-10 scores for most of the indicators we compared for the purposes of this ranking. More precisely, the Arizona office market saw the fourth-highest percentage-point dip in vacancy rate compared to the previous quarter, and office space here had the seventh-lowest vacancy at the close of Q1 among markets larger than 100 million square feet. Phoenix also added the sixth-most office space during the first three months of the year, which represented the fourth-largest market expansion as a percentage of stock. Its fourth-best finish for loans that are expected to mature in the market by the close of the year was another strong performance.
The Dallas-Fort Worth metroplex landed seventh in the Q1 2025 office markets ranking. Its best-performing indicators were its year-over-year increase in average asking rent (second-highest score, behind Orange County); new office space delivered during Q1 (third-highest score); and loan maturities due in 2025 (seventh-best score among markets larger than 100 million square feet).