The Arizona economy was solid through the first half of 2024. Job growth was strong, contributing to a record-low unemployment rate and a surge in the ratio of open jobs to unemployed residents. Income growth remained solid, with over-the-year growth outpacing decelerating inflation. Even so, housing affordability remained low in Arizona (and across the U.S.), in the face of significantly increased housing permit activity.
LEARN MORE: 136 Arizona companies make Inc. 5000 list for 2024
The outlook for Arizona is positive, assuming the U.S. avoids a downturn. If so, Arizona will continue to outpace the national economy, although demographic trends point to slower gains in both the short- and long-run. U.S. recession risks remain an important consideration. The U.S. labor market has likely been a bit weaker than originally thought, which is a concern for future performance. Arizona would likely weather a moderate U.S. downturn with much slower growth but not significant declines in economic activity. The state is much better balanced now than it was before the Great Recession of 2007-2009.
Arizona Recent Developments
Arizona’s seasonally-adjusted unemployment rate ticked up from an all-time low of 3.3% in June to 3.4% in July. That was down from 3.9% in July 2023 and significantly below the 4.3% U.S. rate.
Over the past year, Arizona’s labor market has normalized in some respects but remains tight. The latest data (June 2024) from the Job Openings and Labor Turnover Survey show that the state job quit and hire rates have fallen from recent peaks and are now well below pre-pandemic levels. Arizona’s hires rate in June was 4.0%, which was down from 4.3% on average in 2019. The quit rate was 2.3% in June, down from 2.8% on average in 2019.
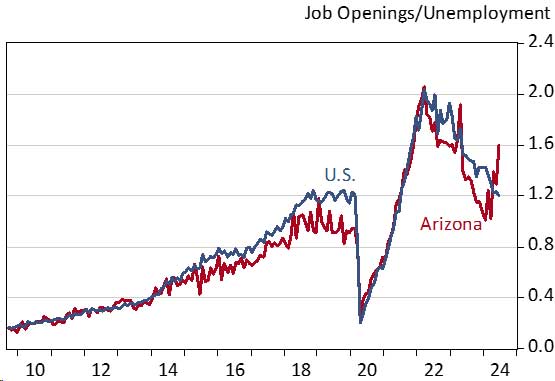
Other aspects of Arizona’s labor market performance (in addition to the unemployment rate) suggest continued tightness. One example is the ratio of job openings to the number of unemployed residents (Exhibit 1). After briefly dropping to near pre-pandemic levels (of about one job per unemployed resident), Arizona’s ratio bounced back to 1.6 openings per job in June. That was well above the national ratio of 1.2. The rise in Arizona’s ratio was driven both by rising job openings and falling unemployment.
Exhibit 1: Arizona and U.S. Job Openings per Unemployed Resident, Seasonally Adjusted
Arizona nonfarm jobs were up 74,300 over the year in July, which translated into 2.4% growth. That outpaced the U.S. at 1.6%. Year-to-date through July state jobs were up 2.2% over the same period in 2023.
Phoenix MSA (Maricopa and Pinal counties) jobs rose 61,600 over the year in July, for 2.6% growth. That accounted for 82.9% of state gains. On average through July, Phoenix jobs were up 2.3% over the year. Job gains by sector were similar to the state.
In July, Tucson jobs were rising at a more modest pace, up 4,600 for 1.2% growth. That accounted for 6.2% of state gains. Through the first seven months of 2024, Tucson jobs were up 1.1% over the year.
Prescott MSA jobs rose 900 over the year in July for 1.3% growth. Year-to-date, jobs were up 1.5% over the year.
Before adjustment for inflation, Arizona total personal income rose 4.6% over the year in the first quarter of 2024, according to preliminary data released by the U.S. Bureau of Economic Analysis. That outpaced the nation at 4.4% over the year.
Net earnings from work in Arizona rose by 5.3% over the year in the first quarter. That was faster than the national rate of 4.7%. Net earnings from work include wages and salaries; fringe benefits, and proprietors’ income. Net earnings are adjusted to account for commuting flows and contributions for social insurance.
Arizona income from dividends, interest, and rent rose 5.5% over the year in the first quarter. That was well above the national rate of 4.4%.
Finally, transfer receipts flowing to Arizona residents (Social Security, Medicare, Medicaid, welfare, etc.) rose 2.0% over the year, which was below the national rate of 3.6% in the first quarter.
Phoenix consumer price inflation was below the national average again in June, with the all-items index rising 2.7% over the year, compared to 3.0% nationally. The Phoenix data are published every other month for most components.
Core inflation (all-items less food and energy) was 3.4% in Phoenix and 3.3% nationally.
The commodities Consumer Price Index for all urban consumers (CPIU) was down 1.6% over the year in Phoenix and down 0.4% nationally. Commodities include tangible goods, like gasoline, food, new and used autos, furniture, appliances, clothing, and other tangible goods.
In contrast, the services CPIU was up 5.1% over the year in Phoenix and up 5.0% over the year nationally in June. Services include consumer purchases of intangible goods, like travel and tourism services, health care, education, and most importantly housing services.
Within housing services, shelter is the most important component. That index includes rent, imputed owners-equivalent rent, and short-term rentals. Shelter inflation surged during 2021-2022, peaking at 19.5% over the year in Phoenix in September 2022. Growth has rapidly declined lately. The shelter CPIU was up 2.6% over the year in Phoenix, which was well below the national pace of 5.2%.
Even though inflation has moderated significantly after peaking in 2022, price levels remain elevated. In Phoenix, the all-items CPIU was up 26.9% in June 2024 compared to the same month in 2020. Nationally, the all-items index was up 21.9% during the same period.
Arizona total housing permit activity has been solid so far in 2024 (Exhibit 2). It was up 27.0% comparing the first seven months of 2024 to the same period of 2023. That was driven by single-family activity, which was up 60.5%. Multi-family permits were down 17.7% during the period.
Exhibit 2: Total Housing Permits for Arizona, Phoenix, and Tucson, Seasonally-Adjusted Annual Rates, Smoothed with Trend/Cycle
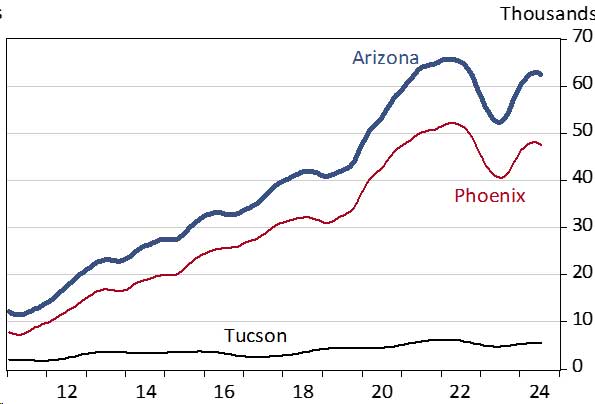
Similarly, total permits were up 26.1% through July 2024 for the Phoenix MSA. Single-family permits were up 61.5% and multi-family permits were down 12.7%.
Total permits were also up strong in Tucson, with an increase of 28.0% through July. Single-family permits were up 54.6% and multi-family permits were down 22.9%.
Keep in mind that housing permit activity in 2023 reflects the annual revision to the Census data.
Arizona Short-Run Outlook
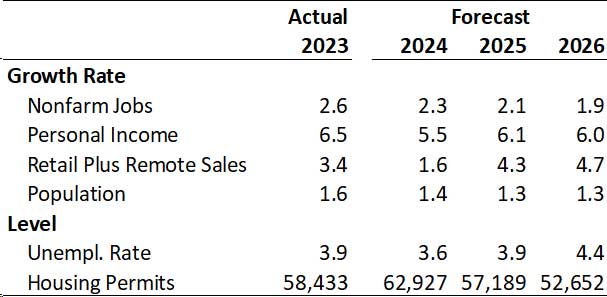
The outlook for Arizona, Phoenix, and Tucson is positive, with the baseline forecast calling for continued solid gains in jobs, residents, and income (Exhibit 3).
The forecast calls for job growth to gradually decelerate in the near term, falling from 2.6% in 2023 to 2.3% in 2024, and then to 2.1% in 2025. This is similar to the national pattern, although Arizona is forecast to far outpace the U.S.
The state unemployment rate gradually rises in 2025 and 2026, reflecting slower employment growth. It is forecast to rise from 3.6% in 2024 to 4.4% by 2026.
Population growth remains solid, but slows as demographic pressures build (slowing natural increase) and as net migration moderates in response to recent declines in housing affordability. The state’s population is forecast to rise by 1.4% in 2024, slower than last year’s gain of 1.6% (according to the Arizona Office of Economic Opportunity). Growth slows again in 2025 to 1.3%.
Exhibit 3: Arizona Short-Run Outlook Summary
Arizona Long-Run Outlook
The long-term outlook for Arizona calls for job, population, and income growth to outpace the national average, but fall short of growth during the prior 30 years.
Arizona jobs are forecast to increase by 1.2 million during the next thirty years, rising at a 1.0% per year average annual rate. That far outpaces U.S. jobs which are forecast to rise by 0.3% per year, but is well below the state pace during the prior 30 year of 2.4% per year.
Likewise, Arizona population is forecast to rise far faster than the U.S., rising by 1.0% per year, compared to 0.3% per year nationally. State population rises by 2.6 million residents by 2054 to 10.3 million. Again, the state pace is well below its average during the 1993-2023 period of 2.1% per year.
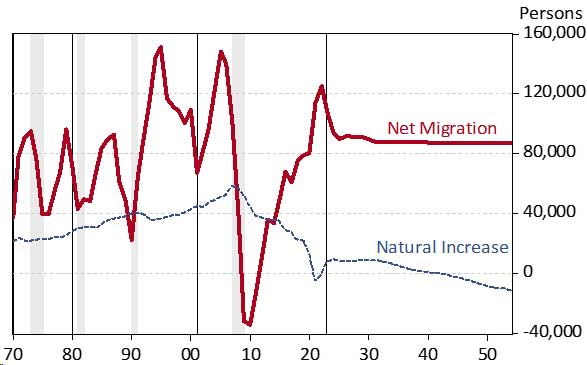
As Exhibit 4 shows, net migration powers state population growth during the next 30 years because natural increase (births minus deaths) gradually loses steam and then turns negative in the early 2040s. Declines in natural increase are driven by rapidly rising deaths, which eventually overwhelm modest increases in births.
Exhibit 4: Arizona Net Migration Powers Population Gains, Net Migration and Natural Increase
With jobs and population rising at about the same pace, the state job-population ratio is little changed during the forecast period, rising from 42.4% in 2023 to 43.4% by 2054.
Risks to the Long-Run Outlook
Longer-term risks revolve around the main drivers of long-run growth: innovation (including human capital development), labor force growth, private physical capital investment, public capital investment, and natural resources.
Innovation will be an even more important source of growth in the future than it has been in the past. Automation and artificial intelligence will be key factors in driving the innovation we need to keep our standard of living rising in the face of slower labor force growth.
With labor force gains expected to slow significantly as population growth slows (in response to an aging population), educational attainment (and human capital more broadly) will be increasingly important. Arizona needs a highly skilled population and workforce in order to take full advantage of the opportunities created by increased use of artificial intelligence. That will require significant investment in education at all levels.
Private capital investment includes the private infrastructure (like telecommunications, buildings, and machinery) used by people to produce goods and services. A competitive tax and regulatory climate is key to generating growth in this type of investment. This includes measures to ease residential construction to improve housing affordability.
Public capital investment (on public infrastructure like highways, roads, water, sewer, border ports, and airports) matters as well. It is important to ensure that public infrastructure investment keeps up with private sector demand. Otherwise, the lack of adequate public infrastructure can choke off growth.
Natural resource availability will also matter, particularly for water. With large cuts to the state’s Colorado River allocation, drought, and climate change, there is growing pressure to change current water use practices and develop alternative supplies. Restricted water availability and/or rising water costs would raise the cost of living and doing business in the state, with negative impacts on growth.
VIEW MOST RECENT FORECAST DATA FOR ARIZONA, PHOENIX, AND TUCSON
If your business or organization requires more timely and in-depth forecast data and analysis, find out about the benefits of joining EBRC’s Forecasting Project and email EBRC director George Hammond at ghammond@arizona.edu.
Author: George W. Hammond, Ph.D., is the director and research professor at the Economic and Business Research Center (EBRC).