Strong demand from both domestic and foreign investors, combined with moderate economic growth, is expected to keep capitalization rates for U.S. commercial real estate assets broadly stable in 2020, according to the latest research from global property advisor CBRE.
The CBRE North American Cap Rate Survey found that industrial, multifamily, and suburban office cap rates tightened the most in H2 2019, while hotel and retail cap rates were generally unchanged except for a negligible increase for retail power centers. In metro Phoenix, cap rates declined across the Class A industrial, neighborhood retail, multifamily and some hotel segments, while cap rates for office, retail power centers, Class B and Class C industrial and some hotel segments remained unchanged or increased.
Continued cap rate stability is expected in the first half of 2020 across property types, segments, classes and market tiers, except for a slight increase in the hotel sector.
“U.S. real estate assets remain in high demand from domestic and foreign investors. Cap rates were stable in 2019 and we expect them to remain so in 2020, despite the uncertainty created by the coronavirus and the upcoming presidential election. Continued moderate economic growth will keep interest rates low, and sustain demand for commercial real estate,” said Richard Barkham, Global Chief Economist for CBRE.
Among the major commercial real estate sectors:
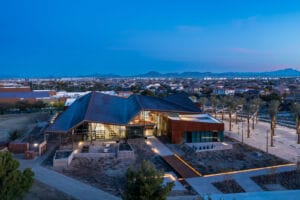
• Office: Strong market fundamentals continue to support competitive pricing for office properties. There were minimal changes in office cap rates in H2 2019, continuing a pattern of stability over the past three years and remaining near record-lows for this cycle. Tier II markets, particularly in the suburbs, were one of the few categories with noticeable downward movement in cap rates. No change in office cap rates is expected in H1 2020.
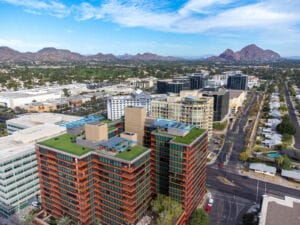
• Cap rates for office properties of all classes in metro Phoenix remained unchanged during H2 2019. Cap rates for stabilized CBD office properties averaged 7.16% while suburban office properties averaged 7.41%. Cap rates for Class AA product in both CBD and suburban sectors were the lowest at 5.75% and 5.88%, respectively.
“Ten years of virtually uninterrupted demand and stable employment growth continue to underpin a favorable and competitive environment for U.S. office properties. Cap rates remain near record lows, supported by cyclically high levels of global and domestic investment capital seeking office assets. Our outlook is for continued cap rate stability for office assets in the first half of 2020,” said Chris Ludeman, Global President of Capital Markets for CBRE.
• Industrial: Soaring asset values led to sustained cap rate compression in H2 2019. Cap rates are expected to remain broadly stable in 2020, with some moderate tightening. Cap rates for acquisitions of stabilized assets averaged 6.13% for all tiers and classes, falling by 13 bps (basis points) in H2 2019. Rates for value-add acquisitions fell by 17 bps to 7.18%. Class A cap rates declined 10 bps to 4.89%, the lowest level since CBRE’s Cap Rate Survey began in H1 2009.
• In Phoenix, demand for high-quality industrial assets was strong. Class A industrial cap rates decreased 50 bps to 5.0%. The average rate for acquisitions of all tiers and classes of stabilized assets fell 17 bps to 6.13%.
“The Phoenix Industrial market has seen 40 straight quarters of positive net absorption outpacing completions; driven by the availability and affordability of labor, the reliability and affordability of power, affordability and availability of housing for employees and the ability to service close to 35 million people in a single-day truck haul,” said Dan Calihan of CBRE Industrial & Logistics in Phoenix. “These factors coupled with the benefits of living in a great climate without any natural disasters continue to drive e-commerce, manufacturing, food & beverage uses, third-party logistics operators and data center locates to Metro Phoenix. Continued economic growth will continue to drive interest from investors and industrial users alike. The future is bright for leasing and capital markets activity in the Valley of the Sun.”
• Retail: Cap rates were relatively stable in H2 2019, especially across Tier I and II markets, and Class A and B properties, with few sales of core assets. Tier III markets and Class C assets attracted increased investment activity among private buyers due to higher risk tolerance and opportunities for redevelopment.
• In Phoenix, the average cap rate for stabilized neighborhood retail assets of all classes fell by 21 bps to 7.43%. Cap rates edged down 13 bps to 6.13% for Class A neighborhood centers while cap rates for Class B and Class C neighborhood centers dropped 25 bps each to 7.5% and 8.63%, respectively. Cap rates for stabilized power centers of all classes remained unchanged at 8.42%.
“Grocery-anchored neighborhood centers remain the favorite retail asset class for investors because of perceived resilience in a recession and relatively low e-commerce penetration. Store formats that incorporate technology to attract consumers and create demand are particularly attractive to investors,” said Melina Cordero, leader of CBRE’s retail capital markets business for the Americas.
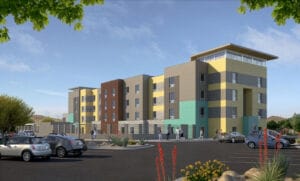
• Multifamily: Cap rates and expected returns on cost remained at historically low levels in H2 2019. Cap rates edged down 9 bps to 5.11% for infill stabilized assets and by 11 bps to 5.37% for suburban assets. Cap rate spreads between Class A and Class C assets, and between Tier I and Tier III markets continued to tighten, indicating that many investors are finding opportunities in lower-quality assets and in secondary and tertiary markets.
• In Phoenix, multifamily cap rates and expected returns on cost continued to drop during H2 2019. Cap rates for infill stabilized property acquisitions averaged 4.75%, a 17 bps decrease from H1 2019. The average cap rates for Class A and Class B assets fell 13 points each to 4.64% and cap rates for Class C assets decreased 25 bps to 4.75%. Expected returns on cost for infill value-add acquisitions averaged 5.63%.
Cap rates for suburban stabilized assets averaged 4.58%, a decline of 21 bps. Stabilized suburban Class A cap rates fell 25 bps to 4.50%, Class B cap rates fell 13 bps to 4.5% and Class C cap rates declined 25 bps to 4.75%. Expected returns on cost for suburban value-add acquisitions averaged 5.63%.
“Phoenix multifamily cap rate compression is a byproduct of the region’s healthy market fundamentals and strong economic drivers, particularly surging population and job growth,” said Matt Pesch of CBRE Multifamily in Phoenix. “Solid multifamily metrics, including low vacancy and nation-leading rent growth driven by historically high demand make Phoenix a top target market for multifamily investors.”
• Hotels: Cap rates were essentially unchanged in H2 2019, down by just 1 bp to 8.27%. Cap rates for both CBD and suburban properties were stable. A long-term trend of shrinking cap-rate spreads between market tiers continued in 2019. Spreads between CBD and suburban full- and select-service hotels remained slightly elevated compared with 2018.
• In Phoenix, cap rates for CBD hotel properties averaged 7.56% and cap rates for suburban hotel properties averaged 7.91%. Cap rates for luxury CBD hotel assets and luxury suburban product edged down 50 bps each to 6.45% and 13 bps to 6.63%, respectively. Cap rates for full-service and economy CBD hotel properties declined 13 bps to 7.63% and 8.88%, respectively, while cap rates for full-service and economy suburban hotel properties increased 13 bps each to 7.88% and 9.38%, respectively.