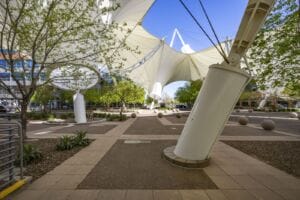
The Greater Phoenix office market kicked off 2018 with stronger momentum in net absorption that experienced in recent years. Vacancy dropped to 15.5 percent and the pipeline of construction projects in this product category is filling. This is all noted in a recent first- quarter report released by Colliers International in Greater Phoenix.
Office tenants moved into a net of approximately 679,000 square feet during the first three months of the year. This net absorption level was a retreat from fourth quarter 2017, but stronger than first quarters of previous years.
Office vacancy fell 30 basis points during the first quarter, dipping to 15.5 percent across the metro area. This level is now 90 basis points lower than a year ago and is the lowest rate in nearly a decade. First quarter vacancy performance marked a full year of quarterly declines in Greater Phoenix. Strongest improvements in vacancy occurred in the Southeast Valley, including Tempe, Chandler and the Superstition Springs submarkets. These areas of the metro area have experienced strong employment growth in recent years. Class A properties had reached a below-15 percent vacancy by year end 2017. The city is now seeing more improvement in Class B properties in which vacancy has dropped 100 basis points in the past 12 months to 16.7 percent.
Asking rental rates in Greater Phoenix reached an average of $24.68 per square foot in the first quarter of 2018, rising 3.9 percent year over year. Rates are expected to rise approximately 4.5 percent during this year. Rental rate advances are stronger in Class B properties than Class A, though both are showing improvement. Class A asking rents are expected to push higher this year as a result of new developments coming online.
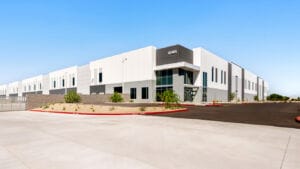
Construction trends have begun shifting towards the office market. Developers are increasingly putting speculative projects in the construction pipeline. Currently, more than 1.5 million square feet of spec space is underway, which is nearly double the total a year ago. Delivery of new projects had slowed in the past 12 months, totaling less than 1.4 million square feet. The pipeline is now filling with more than 2.8 million square feet of spec and build-to-suit office space under construction, 2.2 million of which is slated for completion during 2018.
The investment market had a slower start to 2018, with the total number of properties changing hands decreasing approximately 11 percent from fourth quarter 2017. The biggest decline in sales velocity was in properties commanding $10-25 million prices. Fewer buildings changing hands brought down the median price and cap rates rose a bit. The median price dipped to $139 per square foot, a nine percent drop from this point in 2017. Cap rates averaged approximately 7.1 percent during first quarter 2018. The decline in investment activity is attributed to seasonal trends, but price and cap rate activity is likely the result of the mix of buildings involved in transactions during the quarter and rising interest rates.
The Greater Phoenix office market is expected to post improving conditions in 2018. Healthy job growth remains the primary driver of office space demand. Financial activities, and the professional and business services industries continue to expand. The improving housing market also could provide meaningful demand for the office sector. The investment market prognosis remains mixed, with market fundamentals stimulating demand and increases in interest rates putting pressure on cap rates.